Boats

I’m now working for SkyTruth on an exciting environmental “Big Data” project, Global Fishing Watch. Just last week, a number of my colleagues published a paper in Science, which you can read about in this blog post I wrote.

The key technology behind Global Fishing Watch is AIS – the “Automatic Identification System” that almost all large ocean-going vessels are required to carry. AIS transponders broadcast a vessel’s location and identity every few seconds to every few minutes. The system was originally designed as a ship-to-ship collision-avoidance system, but now we can use it to track, via satellite, the movements of large fishing vessels across the globe.

Below is a map I made from this AIS data, showing the movements of over 200,000 vessels in 2015.
vessel_density_2015

Posted in Maps | Leave a comment

Snowpack

At EcoWest we are working on some graphics to show snowpack across the country. Here’s one I’ve built for California:

Posted in Uncategorized | Leave a comment

Climate Change and the Global Economy: Is the South Doomed?

This week negotiators are wrapping up the most important U.N. climate meeting since Copenhagen. In the lead-up to these meetings, almost every country on earth submitted a plan for how they will reduce their emissions.

These pledges, while better than nothing, fall far short of what almost every expert says we need, and put us on a path to most likely warm the planet by about 3.5 degrees Celsius (about 6 degrees Fahrenheit) this century.

Why should we try to avoid such a future? There are many reasons, but one of the more surprising ones I came across recently was from a research paper by Marshall Burke, Solomon Hsiang, and Edward Miguel, recently published in Science. Burke, Hsiang, and Miguel analyzed how the economy of each country, over the past 50 years, had responded to slight changes in the annual average temperature.

Basically, they found that there is an optimal temperature for economic activity, and when it is warmer or colder than this temperature, people are less productive. I encourage you to read more about the findings of this paper (read Marshall Burke’s website, a blog post by Dr. Burke, or news coverage of the paper). In some ways, these findings actually aren’t too surprising — I do less work when it is hot out.

I worked with these professors to help them build an interactive map showing the results of their paper (which you can see here), and I modified the map to display on the blog below. Click on a country to see what they predict the effects of climate change will be on each country’s economy.

The results are depressing. The global “south,” which is already much poorer than the north, will fall farther behind in this scenario, as warmer temperatures will suppress their economic growth more than temperate nations. In fact, cold nations, such as Canada and Norway may see a benefit.

Posted in climate, Maps | Leave a comment

What’s in the INDCs?

In the run up to this year’s U.N. climate conference in Paris, almost every nation in the world submitted a plan for how they will work to reduce their greenhouse gas emissions and adapt to climate change. These plans, called “Intended Nationally Determined Contributions,” or INDCs, lay out each country’s commitments, and are the starting point for climate negotiations. As of today, 185 countries, representing 97.8 percent of global emissions, have submitted such documents.

So, what’s in the INDCs? According to most experts, the commitments are much better than nothing, but they still fall far short of what we need. For a more detailed reading of what each INDC says, you can read WRI’s great summary of each country’s pledges. Also, if you want to explore these documents a bit more, you can use the map below — a very basic tool that I built to search the INDCs for different words. Want to find out which country mentioned “coal” in their INDC? Or forestry? Or nuclear power? Type away below and find out.


Countries whose INDCs were not in English (or who had their INDC in a format that prevented searching) are shown in light gray. Countries without an INDC are in dark gray.

Obviously, this search tool won’t tell you anything about what different countries say they are going to do about coal or nuclear power. To do that, you’ll have to read the documents yourself.

Posted in climate | 2 Comments

California’s Snowpack and Reservoirs

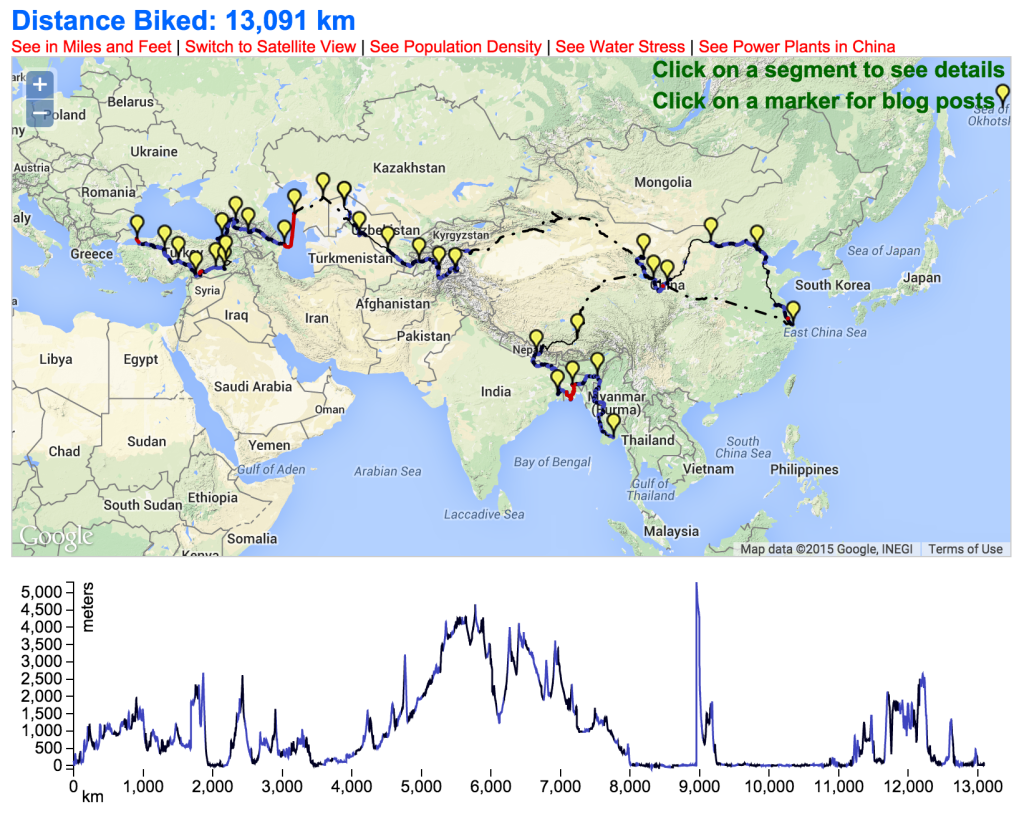
Recent headlines told a dramatic story. By the end of May, California’s snowpack was “zero percent of normal,” and another paper reported “California Snowpack Survey Canceled” due to a lack of snow. I knew it had been a bad snow year, and that the Sierra Nevada usually has some skiable slopes into June and July. But zero percent of normal? What does that mean? How much snow is there usually?

To answer this question, I used a computer model provided by NOAA’s National Operational Hydrological Remote Sensing Center — the Snow Data Assimilation System (SNODAS), which takes weather data and combines it with satellite observations to develop a detailed estimate for how much snow is on the ground everywhere in the country, every day of the year.

The model isn’t perfect. It’s only available for the past 12 winters, and the SNODAS website cautions against using the model to estimate snowfall from specific storms. Moreover, according to Dr. Jeff Dozier, a University of California Santa Barbara professor who researches snow, the model can underestimate snowpack in higher elevations by as much as 20 percent. Nonetheless, he and other researchers I spoke with agreed it was good enough for a statewide estimate of snowpack.

With these caveats in mind, I used the model data to calculate the amount of snow on the ground in California each day for the past twelve years. The results are striking but not too surprising. The winter of 2010-2011 was awesome. The past two have been horrible.

The y axes is measured in “acre-feet” – an acre-foot is the amount of water needed to flood one acre of land in one foot of water, and this graph shows the volume of water we’d have if you melted all of the mountains’ snow on any given day. At the end of March in 2011, there was more than 37 million acre-feet of snow in the mountains – enough liquid to flood all of LA county in 12 feet of water. This year, at the end of March, there was only about one million acre-feet – less than one 30th the amount of snow as 2011.

Snowpack serves a vital function for California’s water supply. The vast majority of California’s precipitation falls as rain and snow in the winter months. The rain fills the reservoir, while the snow accumulates in the mountains, effectively acting as another reservoir. In the spring and summer months, this snowpack gradually releases the water to the rest of California.

How does the water in snowpack compare to our reservoirs? To answer this, I downloaded daily water levels of California’s major reservoirs (I did this with a small team at a water-focused hack-a-thon). Below is a graph of 39 reservoirs, representing more than 95 percent of California’s total reservoir capacity. (Each shade of blue is a different reservoir — roll your mouse over the chart to see the names of each reservoir.)

Each winter and spring, the reservoirs fill because of rain and snowmelt. And then each summer and fall they are drawn down to provide water for our cities and farms. But in successive years of drought, the reservoirs don’t fill, and you can see that we’re currently on a downward sloping staircase. This year we have less than half as much water as we did in 2011.

Combining snowpack and reservoirs gives us a sense of the total water we have “stored” at any given time.
The result is a bit scary. The total water stored in our reservoirs and snowpack peaked at nearly 60 million acre-feet at the end of March in 2011. Currently, it’s less than 10 million.

In a good year, the snowpack stores as much water as all of California’s reservoirs combined. You can also see how melting snow fills the reservoirs every year — in most years, the reservoir levels climb as snowpack decreases in the spring. In a normal year, melting snow fills our man-made lakes until the beginning summer. In 2011, the reservoir levels kept rising until July. This year, there was almost no snow and we have none of that water. Reservoir levels peaked at the end of March and have been declining ever since.

These charts tell only a part of California’s water story. A significant amount of southern California’s water comes from the Colorado River, which is fed by rain and snow falling many thousands of miles away. Also, the state obtains a much of its water from groundwater, with groundwater accounting for the majority in drier years. This groundwater is “mined” — that is, it’s being used faster than it’s being replenished. Stanford’sWater in the West, a collaboration between the Woods Institute for the Environment and the Bill Lane Center for the American West, has a series of excellent articles and infographics on just how fast we are depleting our groundwater.

It’s possible that a few years of good rain and snow could replenish our water supplies, much as happened between 2008 and 2011. And it’s possible that an El Niño this year could give us another year like 2011 (but that could bring its own problems). Regardless, we’ll likely need a few years of above average precipitation to refill our state’s water storage.

Posted in Water | Comments Off on California’s Snowpack and Reservoirs

All The World’s Power Plants

When traveling across China by bicycle, I was amazed by how we seemed to pass a new power plant almost every day. I found myself wanting a map of where the power plants were in the country. Are they everywhere, or only where we were riding?

I found an online database of power plants from Carma.org. While on a train ride in western China, I wrote a Python script to download the entire database and then make a map of where the power plants were located — and I scaled them both by the amount of carbon and electricity they produced. Go to the interactive map of our trip and click on the link “See Power Plants in China.” One reason we passed a lot of power plants is that we followed the Yellow River, and power plants are often located along rivers. Another reason we passed so many power plants is that there are a lot of power plants in China.

Screen Shot 2015-05-17 at 1.36.59 PM

The Carma datset is global, so I also made a map of the entire world. The following two maps show the Carma dataset. The first map (blue markers) shows power plants scaled by the amount of electricity they produce. The second map shows power plants scaled by their carbon emissions. A few things jump out at me from these maps. The biggest difference between the two maps is in hydro-power plants in the world. South America has a number of hydropower plants that produce very large amounts of electricity (and thus are big blue dots), but almost no carbon (and thus are absent from the carbon emissions map). It is also amazing how much of the world produces very little energy.

Power Plants Scaled by Energy Production

Power Plants Scaled by Energy Production – From Carma.org

Power Plants Scaled by Carbon Emissions

Power Plants Scaled by Carbon Emissions – From Carma.org

Posted in Maps | Leave a comment

Interactive Map of Ride for Climate Asia

On Lindsey’s and my recent journey across Asia, I was sure to record every day on our Garmin GPS. This not only helped me get a few “King of the Mountains” on Strava, but more importantly, it allowed us to build a detailed map of our route.

Using a Python library that parses Garmin .fit files, I was able to extract the information from each day’s ride and then plot it on an interactive map using OpenLayers. I then built an elevation profile using d3. Click on the image below to explore! You can access blog posts about any part of the trip by clicking on the yellow markers. I also added overlays of population density, water stress (taken from WRI’s Aqueduct), and the location of power plants in China — just click on the links above the map on the right.

Screen Shot 2015-05-15 at 3.53.30 PM

There are a few things I’d like to improve with this map. For one, it includes a lot of data points — about one per kilometer, which is more than 13,000. As a result, the map runs slowly on most people’s computers. It would be nice if I could show a lower-resolution version of our route when zoomed out, and then dynamically show higher resolution as you zoom in. Secondly, the elevation profile is a bit unintuitive — I show the profile for the sections that we biked, not the parts that we bussed, trained, or hitchhiked. As a result, when we took a train to Tibet and then started biking, it looks like we went straight uphill 16,000 feet. Needless to say, we didn’t do that.

Posted in Maps | Leave a comment

All the World’s Reservoirs

Here’s a little project I’ve been working on: All of the world’s reservoirs, as seen by the GRanD database. I think it still needs a few tweaks — let me know if anything looks off.

Reservoir capacity is proportional to the size of each dot. Note that capacity is measured as the extra capacity created by a manmade dam. For instance, Lake Victoria in Africa is here because there is a dam on it — but the “capacity” includes only the few feet at the top of the reservoir that can be controlled by the dam.

Posted in Maps | Leave a comment

Fun with Python and Basemap

I recently re-edited my film Ten Tips for Biking Eastern Europe to submit to the Banff Film Festival (yes, a reach, but why not?). I had to alter the film because the old version uses Google Earth to show our bike route, and this is, of course, copyrighted. So I had to make a non-copyrighted map.

To make a new map, I took the KML file of my bike route (which I produced by combining all of the GPS files from the route), and using the Python library matplotlib and the toolkit extension basemap, plotted the route on NASA’s “blue marble” image of the earth, which is an image of the entire earth created by combining cloud-free satellite images. According to my sources, I can use this NASA image as my map background as long as I attribute it. (Note: the image used in the map background below is brought to you by NASA).

test2

Pretty, eh? I wish the blue marble background image were a bit higher resolution, but I think it looks good enough.

This took a long time, not because the coding was difficult (I borrowed code from here and here), but because it took forever to get the Python libraries installed correctly. And, when I did get the libraries installed, the blue marble background image, for some reason, showed up backwards. To right everything, I had to change the “backend” rendering of the matplotlib library by installing WxAgg (As with most Python library challenges, I just followed advice from the Internet until I got it to work).

Posted in Maps | Leave a comment

Where My Friends Have Traveled

A few months ago, we had a housewarming party and about 30 guests, mostly people roughly my age living in San Francisco, attended. I put a map of the world on the wall, and we asked people to mark each country that they had visited. I then entered the data into excel and used Google Charts Tools Geomap to make the following map of where people I know, who showed up to a party in San Francisco, have traveled.

I think it is absolutely fascinating that not one of the 30 partygoers had been to many places in central Africa, most of the Middle East, or a string of Eastern European countries stretching from the Baltic Sea to the Black Sea. Also, it’s interesting that only one person at the party has visited Russia, and that my friends were just as likely to have visited France and the UK as they were to have visited Mexico.

There’s a lot to say here. I will be revisiting this map.

Posted in Uncategorized | Leave a comment